Beautiful Data Visualisation
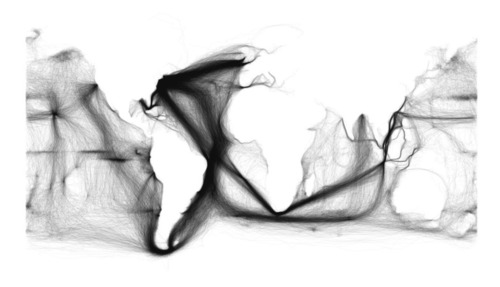
“Ben Schmidt, assistant professor of history at Northeastern University, has visualized the routes of 19th Century ships using publicly available data set from NOAA (National Oceanic and Atmospheric Administration). The resulting image is a hauntingly beautiful image that outlines the continents and highlights the trade winds. It shows major ports, and even makes a strong visual case for the need for the Panama and Suez Canals.”
Tracey M Benson‘s insight:
Beautiful data visualisation of 19th century shipsusingpublicly available data setfromNOAA(National Oceanic and Atmospheric Administration).
See on unifiedpoptheory.com

Leave a comment